Some guidence that I once read said that it's easier to develop a custom visual by first making the code and visual work outside of PowerBI, then porting it in. So that's where I started. I of cause used D3, but the visuals I created where primitive and boaring. I also then failed to get them into PowerBI anyway.
I remember being at SQLBits visiting the DELL stand to get my book stamped and I noticed something which gave me an idea. Cardboard.. more specificly Google Cardboard. Being an IT geek, I was interested in VR and AR, but I'd not really experimented with it. But seeing how easy and accesable the equipment could be, I stared thinking about using it as a 3D Visual representation of Data. Basicly using the power of 3D to create an emerse data visualisation.
The idea would not go away, and I quickly learnt how to develop 3D webbased visuals using WebGL and the THREE.JS library. I did experiment with VR and AR, but I was disapoited with the results. Mostly the lack or complexity of interactivity. If I put my phone in the cardboard/vr-headset, then how do I interact with the visual?..
Here are some examples of the visuals I was able to create using THREE.JS.
 |
| Clock Visual |
 |
| Flag Visual |
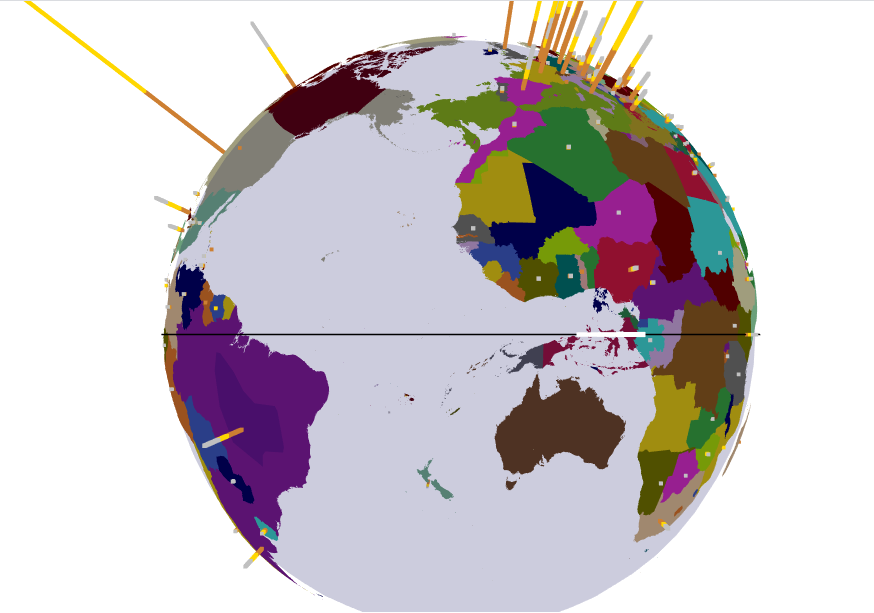 |
| Globe Visual |
 |
| Map Visual |
 |
| Spiral Visual |
All that aside, I got a lot of attention with the 3D visualisations I was able to create in a browser. However, I was still unable to get this into PowerBI. Another year passed, and SQL Bits had a session on Creating your own PowerBI Visualisations. A must attend session for me. But the session was busy, and I ended-up standing outside the dome trying to take in as much as posible. I got the basics and it looked so simple.
I was very quickly able to create basic custom visuals what just showed tables and primitive charts, but every attempt I made to load the THREE.JS library failed. Typescript was new to me and I was getting lost in typings and finding any documentation limited and confusing. I tried reaching out for help online, but nothing worked for me.
I must have revisited my code about once every 6 months or so attempting to port my visual into PowerBI using the latest framework, tooling and documentation. There had been many improvments, but I always ended up stuck with some wired error message which I could not make sense of and google seemed unable to help me either.
Last year, I had a breakthrough. I think I'd been getting confused with old documentation and my lack of knowledge about typescript. It could not be any simpler... Create Visual, Install THREE.JS, Write Code. No need for typings, chaning build configuration or anything. It just worked. I was both exstatic that I could finally attempt to port my 3 year old visual into PowerBI, but also frustrated that it was so simple, and I'd lost so much time going round in circules.
My next posts will show how to create a PowerBI Custom Visual with THREE.JS and some walkthroughs of the visuals I have created.
No comments:
Post a Comment